> ## Documentation Index
> Fetch the complete documentation index at: https://docs.bijection.com/llms.txt
> Use this file to discover all available pages before exploring further.
# Health
> Monitor your Bijection deployment health including failure rates, cache performance, scheduler status, and deployment insights for optimization.
The [health page](https://console.bijection.com) is the landing page
for your deployment. On this page, you can see some important information about
the health of your deployment.
## Failure Rate
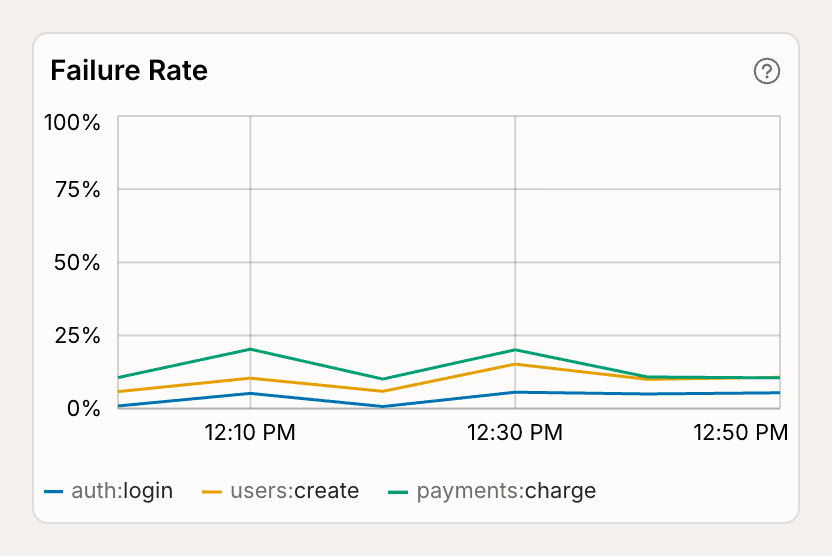 The failure rate card shows the percentage of failed request by minute ove the
last hour. The failure rate is calculated as the number of failed requests
divided by the total number of requests.
## Cache Hit Rate
The failure rate card shows the percentage of failed request by minute ove the
last hour. The failure rate is calculated as the number of failed requests
divided by the total number of requests.
## Cache Hit Rate
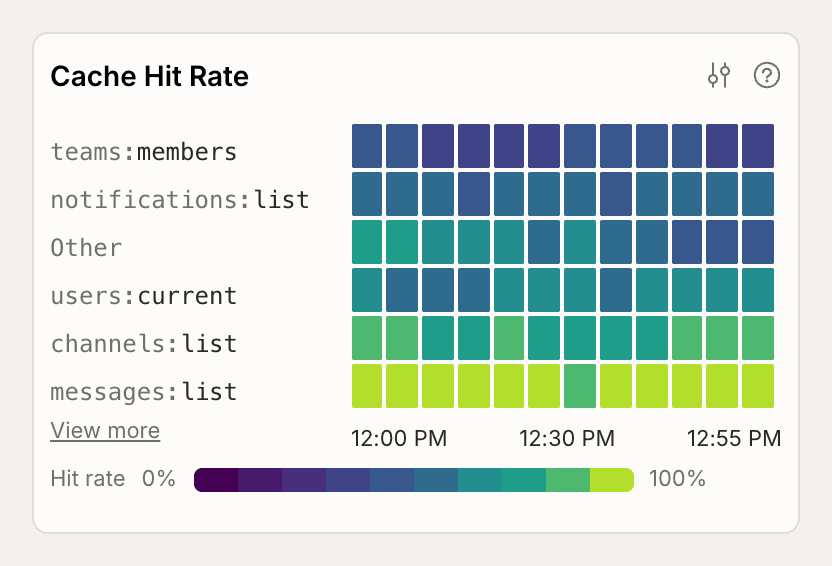 The cache hit rate card shows the percentage of cache hits by minute over the
last hour. The cache hit rate is calculated as the number of cache hits divided
by the total number of requests.
Cache hit rate only applies to query functions.
## Scheduler Status
The cache hit rate card shows the percentage of cache hits by minute over the
last hour. The cache hit rate is calculated as the number of cache hits divided
by the total number of requests.
Cache hit rate only applies to query functions.
## Scheduler Status
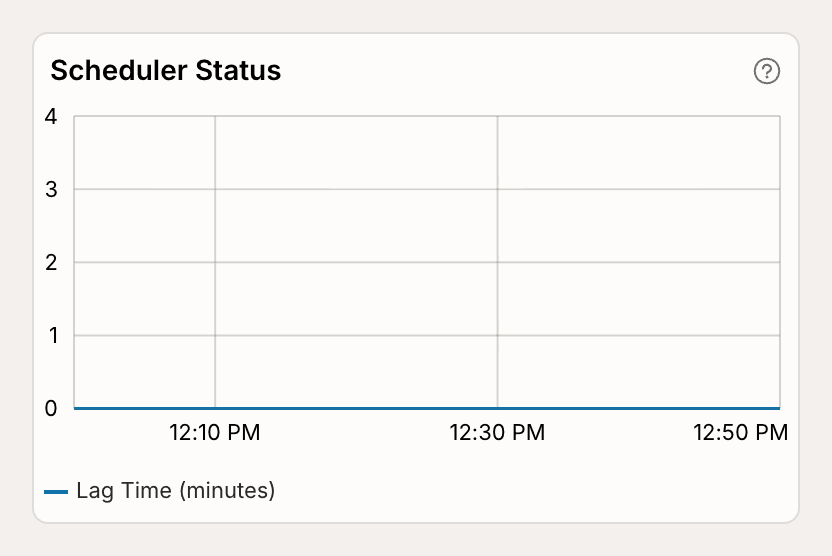 The scheduler status card shows the status of the
[scheduler](/scheduling/scheduled-functions). If the scheduler falls behind due
to too many scheduled tasks, the status will display the lag time in minutes.
## Last Deployed
The last deployed card shows the time of the last time your functions were
deployed.
## Integrations
The integrations card shows the status of your
[Exception Reporting](/production/integrations/exception-reporting) and
[Log Streams](/production/integrations/log-streams/log-streams) integrations, with quick
links to view and configure your integrations.
## Insights
The Health page also surfaces insights about your deployment, with suggestions
on how to improve performance and reliability.
Each Insight contains a description of the issue, the impact on your deployment
(via a chart and event log), and a link to learn more about the issue and how to
resolve it.
Clicking on an Insight will open a breakdown of the issue, including a larger
chart and a list of events that triggered the Insight.
Available insights include:
* Functions that are
[reading too many bytes](/production/state/limits#transactions) in a single
transaction.
* Functions that are
[reading too many documents](/production/state/limits#transactions) in a
single transaction.
* Functions that are experiencing [write conflicts](/error#write-conflict-optimistic-concurrency-control).
The scheduler status card shows the status of the
[scheduler](/scheduling/scheduled-functions). If the scheduler falls behind due
to too many scheduled tasks, the status will display the lag time in minutes.
## Last Deployed
The last deployed card shows the time of the last time your functions were
deployed.
## Integrations
The integrations card shows the status of your
[Exception Reporting](/production/integrations/exception-reporting) and
[Log Streams](/production/integrations/log-streams/log-streams) integrations, with quick
links to view and configure your integrations.
## Insights
The Health page also surfaces insights about your deployment, with suggestions
on how to improve performance and reliability.
Each Insight contains a description of the issue, the impact on your deployment
(via a chart and event log), and a link to learn more about the issue and how to
resolve it.
Clicking on an Insight will open a breakdown of the issue, including a larger
chart and a list of events that triggered the Insight.
Available insights include:
* Functions that are
[reading too many bytes](/production/state/limits#transactions) in a single
transaction.
* Functions that are
[reading too many documents](/production/state/limits#transactions) in a
single transaction.
* Functions that are experiencing [write conflicts](/error#write-conflict-optimistic-concurrency-control).